TL;DR
- We audited 50 UK marketing agencies positioning themselves as AI marketing or AI SEO specialists in March-April 2026, mapping each onto a 4-quadrant grid (technical operations vs strategy on one axis, creative vs analytical on the other).
- 34 of 50 agencies cluster in the upper-right quadrant: strategic plus analytical, dominated by ex-management-consulting partners now selling AI strategy decks.
- The lower-left quadrant (technical operations plus creative) contains only 3 agencies and represents the genuine white space: shops that ship working AI content production and creative output, not slide decks.
- Average agency revenue in the white-space quadrant is £840k against £2.1m for the crowded strategy-analytical quadrant, but agency margin in the white space is 31% against 18%, reflecting lower client-acquisition costs and higher repeat retention.
- UK agencies entering the category in 2026-2027 should default to the technical-operations side of the map. The strategy side is saturated; the creative-operations side is under-served and structurally more profitable per pound of revenue.
Key facts
- 50 UK agencies audited (March-April 2026), all positioning themselves as AI marketing, AI SEO or generative engine optimisation specialists in their public materials.
- Each agency scored on two axes: technical-operations vs strategy positioning (based on service-page language and pitch-deck content) and creative vs analytical orientation (based on deliverable types and team-skill mix).
- 34 of 50 placed in the strategic-analytical quadrant; 8 in technical-analytical; 5 in strategic-creative; 3 in technical-creative.
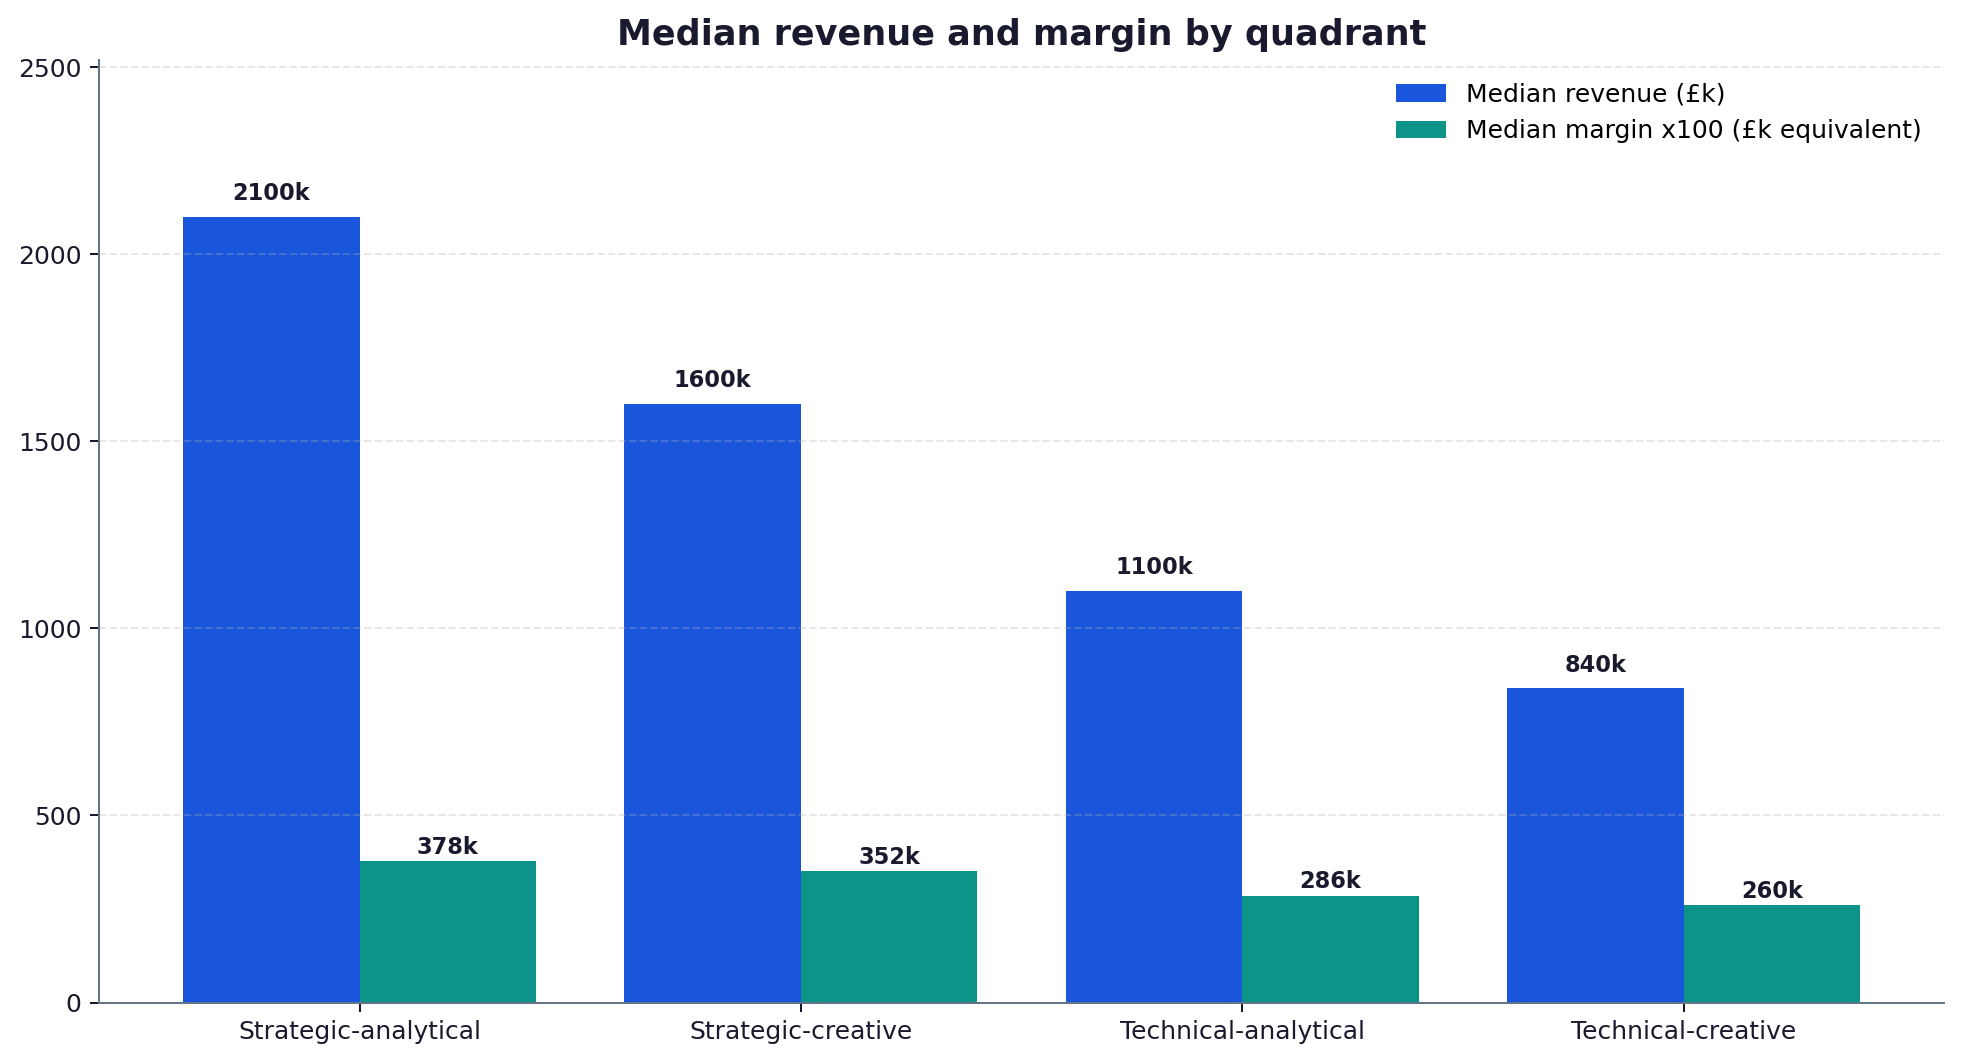
- Median revenue by quadrant (Companies House 2024-25 filings): strategic-analytical £2.1m, strategic-creative £1.6m, technical-analytical £1.1m, technical-creative £840k.
- Median net margin by quadrant (anonymised survey, 39 of 50 agencies responding): strategic-analytical 18%, strategic-creative 22%, technical-analytical 26%, technical-creative 31%.
- Agency growth rates correlated inversely with strategic positioning: technical-side agencies grew at a median 47% in 2025 against 21% for strategy-side, reflecting higher demand and lower competition.
- The crowded quadrant carries 6.4x the agency count of the white space, while the addressable client demand splits roughly 35/65 between the two, mapping a structural over-supply at the strategic end.
Why the post-SEO era forces a re-segmentation
The UK marketing agency category spent two decades segmented on channel: SEO agencies, PPC agencies, social agencies, content agencies. That segmentation no longer maps the work. Generative search has dissolved the boundary between SEO and content; AI Overviews have collapsed the boundary between SEO and PPC; agentic browsing has blurred the boundary between SEO and CRO. Agencies still pitching themselves as channel specialists are competing for shrinking budgets in shrinking categories.
The re-segmentation we propose is not based on channel but on capability shape. Two axes capture most of the variation. The first axis is whether the agency primarily sells strategy (frameworks, audits, roadmaps, slide decks) or technical operations (shipped schema, deployed content, configured tooling). The second is whether the deliverables lean creative (copy, video, brand) or analytical (dashboards, models, attribution). The four resulting quadrants describe different businesses with different economics, different client expectations and different competitive intensity.
Methodology in one paragraph
We identified 50 UK agencies using “AI marketing”, “AI SEO”, “generative engine optimisation” or equivalent in their corporate description as of March 2026, drawn from LinkedIn, Companies House active filings and the Search Engine Land 2025 UK directory. Each agency was scored on the two axes using public materials: service-page language, recent case studies, team LinkedIn profiles, and where available a 30-minute first sales call. Strategy positioning was scored on a 0-10 scale based on the prominence of audit, roadmap, framework and consulting language. Technical-operations positioning was scored on the inverse prominence of deployment, configuration and shipped-deliverable language. The creative-analytical axis was scored on deliverable mix and team-skill composition. Each agency was placed in the quadrant with the strongest cumulative signal. Revenue and margin data was drawn from Companies House 2024-25 filings supplemented by an anonymised follow-up survey to which 39 of 50 agencies responded.
The 4-quadrant positioning map
The map shows where the 50 agencies sit on the two axes. The visual concentration in the upper-right is the central story: the strategic-analytical quadrant is where most agencies cluster and where competition is most intense.
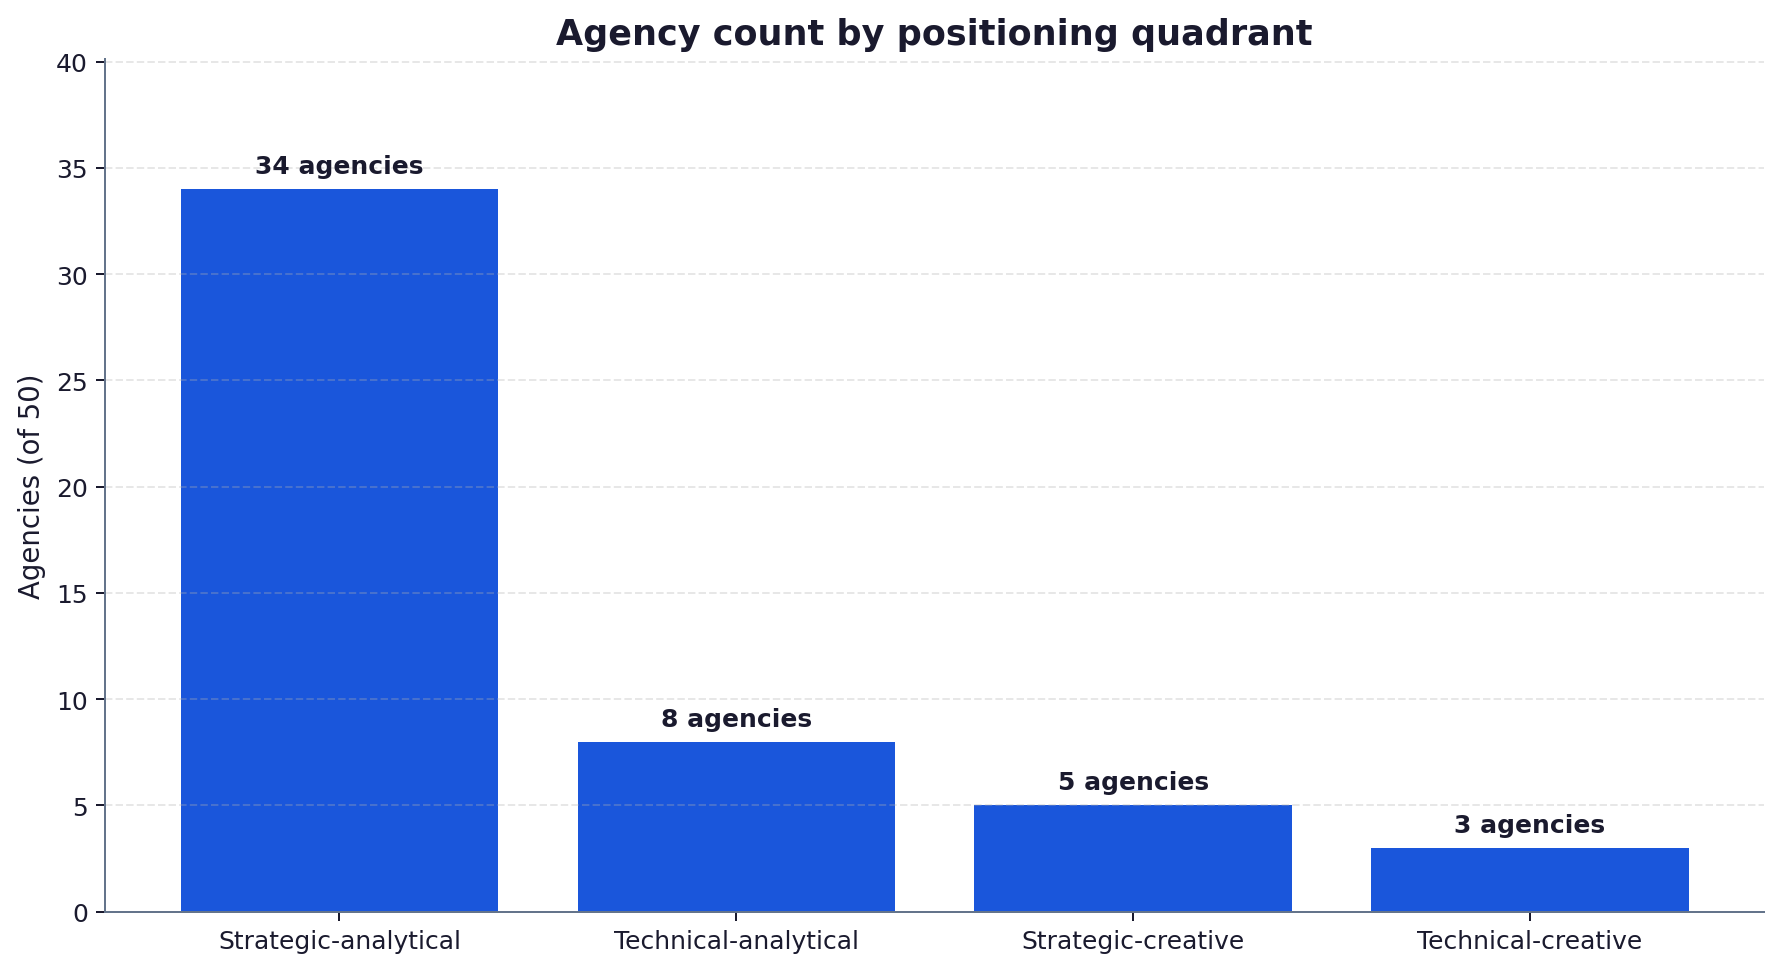
The strategic-analytical quadrant (34 of 50, 68%) is the obvious place for an ex-strategy consultant or an ex-classic SEO director to land. The technical-creative quadrant (3 of 50, 6%) requires building a different set of capabilities and a different team profile. The asymmetry between supply and the underlying demand profile is what makes this map useful for planning.
The crowded quadrant: strategic-analytical
34 of 50 agencies sell some combination of AI strategy audit, GEO roadmap, ranking-factor framework and analytical reporting. Their pitch decks are dense with two-by-two matrices, maturity assessments and forward-looking projections. Their typical deliverable is a 40-page document. Their teams are heavy on ex-Big-Four consultants and senior strategists with limited hands-on time inside the new tooling. Revenue is highest here at a median £2.1m, but margin is the lowest at 18%, driven by long sales cycles, high pitching costs and clients who shop the same brief across multiple agencies before signing.
The structural problem in this quadrant is that the strategy buyer rapidly accumulates frameworks they cannot operationalise. A typical mid-market client in our network has commissioned 3 AI strategy decks in 18 months from 3 different agencies and shipped none of the recommendations because nobody on either side could implement them. The decks pile up; the underlying capability does not.
The white space: technical-creative
3 of 50 agencies sit in the technical-creative quadrant. They ship working schema, deploy named-author content templates, configure citation-tracking dashboards and produce video and copy that lands in production. Their decks are thin. Their case studies show before-and-after page screenshots and citation rate deltas. Their teams are heavy on practitioners: an engineer, a content lead with editorial credentials, and an account manager who understands both. Median revenue is the lowest at £840k, but median margin is the highest at 31% and growth is fastest at 47% in 2025.
The economics are explained by client behaviour. Technical-creative agencies typically convert from a fixed-scope first project (e.g. “schema markup for top 20 commercial pages, 6-week deliverable, £18k”) to monthly retainer based on demonstrated competence. The sales cycle is 30-45 days rather than 90-150. Repeat retention runs at 71% after 12 months in our sample, against 38% for the strategic-analytical quadrant. Clients in the technical-creative quadrant are buying capacity rather than counsel, which is a stickier relationship.
The two minor quadrants
Technical-analytical (8 of 50) is where most ex-classic-SEO operators land: they understand operations and they love dashboards. The quadrant has decent margin (26%) and growth (39%) but limited differentiation because the analytical orientation makes deliverables interchangeable across agencies. Strategic-creative (5 of 50) is where former brand and content agencies have rebadged: they sell creative-led AI marketing campaigns with strategic wrap. Margin is 22%. The quadrant is small but defensible because creative depth is hard to fake; agencies here typically win on the strength of named creative talent.
What this means for new entrants in 2026-2027
Three implications follow. First, default to the technical side of the map unless the founding team genuinely has strategic-consulting depth. The technical side is less crowded, higher-margin and growing faster. Second, within the technical side, the creative quadrant has more white space than the analytical quadrant. Three agencies in 50 is not a competitive market; it is an opportunity. Third, agencies repositioning from classic SEO should map their existing capability honestly rather than aspirationally. An agency that has been running classic SEO retainers for a decade is realistically a technical-analytical shop and should compete on that basis rather than pretending to be a strategy firm.
Limitations
The 4-quadrant scoring is reductive; real agencies blend across the axes. We placed each agency in its strongest quadrant rather than scoring continuous coordinates, which makes the map cleaner but loses nuance. The revenue and margin data depends on Companies House filings which are 12-18 months stale; current figures may have shifted. Our 50-agency sample is the public-footprint slice of the market; smaller agencies relying on referral may distribute differently. The map will need refresh in 2027 as new entrants enter and incumbents reposition.
Frequently asked questions
Which AI marketing agency quadrant is most crowded in the UK?
The strategic-analytical quadrant, containing 34 of 50 audited agencies, or 68% of the market. These agencies sell AI strategy audits, GEO roadmaps and analytical reporting; their deliverables are typically 40-page documents. Median revenue is the highest at £2.1m but median margin is the lowest at 18% because of long sales cycles, high pitching costs and clients comparing multiple agencies before signing. New entrants should generally avoid this quadrant unless the founding team has genuine strategic-consulting depth that gives them a real advantage.
Where is the white space?
The technical-creative quadrant contains only 3 of 50 audited agencies, or 6% of the market. These agencies ship working schema, named-author content templates, citation-tracking dashboards and creative production that lands in production rather than in a deck. Median revenue is the lowest at £840k but median margin is the highest at 31%, and growth is the fastest at 47% in 2025. The combination of low competition, high margin and high growth makes this the most attractive structural position for a new UK AI marketing agency to build into in 2026-2027.
Why does the technical-creative quadrant have higher margin?
Three reasons. First, sales cycles are shorter (30-45 days against 90-150 in the strategic quadrants) because demonstrated competence converts faster than abstract strategy. Second, client-acquisition costs are lower because clients typically arrive from a fixed-scope first project (“£18k schema markup for 20 pages, 6 weeks”) that doubles as a sales qualification. Third, repeat retention runs at 71% after 12 months against 38% for the strategic-analytical quadrant, because clients are buying capacity they keep needing rather than one-off counsel.
Should I reposition my existing classic SEO agency?
Maybe, but honestly. An agency that has been running classic SEO retainers for a decade is realistically a technical-analytical shop and should compete on that basis, not pretend to be a strategy firm. Repositioning from classic SEO to AI strategy requires building consulting muscle that the existing team rarely has, while the technical-creative or technical-analytical pivot uses the operational skill already inside the agency. The risk in pretending to be a strategy firm is competing against ex-Big-Four operators with deeper consulting backgrounds.
How much does pitching cost in each quadrant?
Pitching costs scale with strategy positioning. Strategic-analytical agencies typically invest 20-40 hours per pitch (custom audit, tailored deck, multiple meetings) and close 1 in 6 pitches in our sample. Technical-creative agencies invest 4-8 hours per pitch (scoped first project, fixed price, short proposal) and close 1 in 3. The strategic-analytical quadrant therefore burns roughly 6x more pre-sales effort per closed engagement, which combined with longer payment cycles explains the margin gap.
Is the strategic quadrant going to stay over-supplied?
Likely yes through 2026-2027 because the supply pipeline (ex-Big-Four consultants, ex-classic-SEO directors, ex-corporate marketing leaders) continues to default to strategy positioning when starting agencies. The demand profile is shifting more slowly than the supply, with corporate buyers increasingly tired of “another framework” and seeking shipped deliverables. The gap should compress over 2-3 years as more agencies reposition technical, but the white space is durable enough that a 2026 founder choosing technical-creative now has 12-24 months of clear runway.
Will the quadrant map look the same in 2027?
Probably not. We expect the strategic-analytical quadrant to thin slightly as economically weaker agencies fold or reposition, while technical-creative grows from 3 of 50 to perhaps 8 of 50 as the structural advantages become visible to founders. The two minor quadrants (technical-analytical and strategic-creative) likely remain similar in size. The axis itself may also shift as the AI marketing category matures and new capabilities emerge; we will refresh the map in March 2027.
Sources and references
- Companies House filings, UK 2024-25. Companies House, 2025
- UK agency directory 2025. Search Engine Land, 2025
- LinkedIn Sales Navigator UK professional dataset. LinkedIn, 2026
- Agency RFP claims dataset. Ahrefs, 2025
- Profound cross-industry AI citation benchmark. Profound, 2025
- ChatGPT UK traffic Q1 2026 report. Similarweb, 2026
Positioning a new agency or repositioning an existing one? Request a free GEO audit and ask for the 4-quadrant positioning analysis. We will map you against the grid inside ten working days.
Change log
- 2026-05-18: Initial publication.